2013 Humane Education Study
Please note that this report is archived, as it was written in 2013 and is not up to our current standards.
ACE coordinated a study in Fall 2013 that investigated the efficacy of humane education programs aimed at high school and college students. Students in classes where humane education presentations have been conducted and students enrolled in other classes on the same campuses filled out surveys online. The two groups’ rates of recent conversion to vegetarianism and veganism were compared.
- Background
- Methodology
- Presentations
- Control Group Recruitment
- Survey Procedures
- Official Protocol
- Analysis
- Materials
- Cooperating Organizations
Background
A wide variety of organizations run humane education programs on topics including the environment, social justice issues, and animal issues. Our focus with this study is to understand the effectiveness of humane education programs focused on issues with factory farms, since we believe reducing suffering on factory farms to be an especially promising opportunity for action in general. Programs of this type are conducted by many organizations, including The Humane League, one of ACE’s top charities at the time of this study. Presentations are commonly delivered in high school and college classes at the invitation of the instructor, allowing the speaker to reach a diverse range of students who might not specifically have sought out material about animal rights or factory farming.
Currently, evidence in support of humane education as an intervention to create dietary change is weak and largely anecdotal. Organizations often get feedback from students only once, immediately after the lecture. ACE’s analysis of humane education as an intervention uses data from a survey students could visit online immediately after viewing presentations, but notes that the survey is better for providing insight into what aspects of humane education programs have the most impact than for determining how much impact those programs have. With this study, we plan to use a control group and a neutral-appearing survey to fill in this gap by checking whether students who have recently seen a humane education presentation are more likely than other students to have recently converted to a vegetarian or vegan diet.
Methodology
Presenters from our partner organizations in this study will collect student email addresses before the presentations they give during the study period, saying that they are doing so to enter students in a raffle as thanks for their participation. They will then deliver the presentations as usual. Presenters will also attempt to gather control participants at these same schools by distributing business cards to students who did not attend the presentations.
Students who receive the business cards may follow a link on the cards to fill out a survey in return for a chance at a prize and thus join the control group. Students who gave their email addresses at the presentation will receive an email seven to nine weeks later with an invitation to fill out a survey and get a second entry in the raffle. If they choose to do so, they will fill out the survey as part of the experimental group.
A little more than nine weeks after the last presentation, both surveys will be closed and data will be tabulated and analyzed.
Presentations

Organizations involved in the study will give the presentations they have scheduled for fall 2013 as usual. For those presentations between September 9th and November 30th that take place in high schools and colleges, they will also collect email addresses from students at the beginning of the presentation. To encourage them to participate, students will be told that by providing their email addresses, they are entering a $500 raffle. Speakers will make clear that students are not also signing up to receive regular communication from the presenting organization, to avoid obtaining a biased sample. Presenters are encouraged but not required to use the provided Email Sign-up Sheet in this process.
Students who respond to a follow-up email containing a survey link will constitute the experimental group for this study.
View the Instructions for Presenters.
Control Group Recruitment
Presenters will also be provided with a number of business cards advertising a chance to win $500 for taking a short survey. They will distribute these cards to students who have not heard the presentations on as many campuses as they can. We expect that this will largely be accomplished by asking instructors to distribute the cards to those of their classes that the presenter did not visit and by leaving the cards in high-traffic areas like student centers. Each organization will be provided a number of business cards proportional to the number of students they expect to present to during the study period. This will help ensure that the control group is as similar in composition to the experimental group as possible.
The students who take the survey by following the link on the business cards will form the control group for the study.
View the Instructions for Presenters.
Survey Procedures
Control group participants will be able to take the survey immediately upon receiving the business cards. Students who provided their email addresses at the presentations will receive an email seven to nine weeks later telling them that they have already been entered in a raffle to win $500 and can receive another entry and double their chances of winning by completing a survey.
None of the business cards, emails, or survey landing pages will refer to humane education presentations or to animal activist causes. Both surveys will begin as identical general diet surveys, but some questions asked after the answers to the diet portion are submitted will be different for the control and experimental groups.
One $500 raffle will occur. Control group participants and students who gave their email addresses at the presentation but did not take the survey will each have one entry in the raffle, while experimental group participants will each have two entries in the raffle.
View the survey.
View the full protocol for this study.
Analysis
The primary goal of the analysis will be to determine whether students who attend humane education presentations are more likely to have become vegetarian or vegan in the months prior to taking the survey than students in the control group. Depending on survey design, the analysis may also consider whether students who have seen the humane education presentation reduce consumption of animal products overall as compared to their peers who have not seen the presentation. If the sample size is large enough, the analysis will also consider these questions for smaller segments of the population studied, such as for high school students specifically.
We have now completed our analysis of the data collected in this study. Read the full analysis.
Please note that this report is archived, as it was written in 2013 and is not up to our current standards.
This page presents an analysis of the results of ACE’s 2013 study on leafleting, prepared by ACE staff with help from Diana Fleischman.
- Pre-analysis Plan
- Main results
- Assignment of Experimental and Control Groups
- Conversion to Vegetarianism and Veganism
- Meat Reduction
- Additional results
- Respondent Characteristics
- Attitudes about Diet
- Attitudes about Animals
- Conclusions
- Resources
Pre-analysis Plan
“The primary goal of the analysis will be to determine whether students who attend humane education presentations are more likely to have become vegetarian or vegan in the months prior to taking the survey than students in the control group. Depending on survey design, the analysis may also consider whether students who have seen the humane education presentation reduce consumption of animal products overall as compared to their peers who have not seen the presentation. If the sample size is large enough, the analysis will also consider these questions for smaller segments of the population studied, such as for high school students specifically.”
Main results
Assignment of Experimental and Control Groups
Our study design used presenters’ existing humane education presentations to provide us with an experimental group. To find a matched control group, we exploited the fact that students have only a minimal amount of choice regarding whether to attend a presentation, since the presentations are typically organized by the instructor and take place during a class meeting. Therefore, students at a school which has such presentations but who do not attend a presentation themselves are likely very similar to students who do attend the presentation, differing slightly in age or interests (generally, not interests explicitly related to the content of the presentation, but to the course material in general), or simply randomly assigned to a class with a different instructor.
Presenters recruited experimental group participants by collecting their email addresses before their presentation started. About two months after each presentation, we emailed these participants a link to a survey; anyone who used that link, we considered to be in the experimental group, whether or not they also reported seeing a presentation. There were 169 participants in the experimental group.
Presenters recruited control group participants by passing out business cards at the same schools where they gave presentations. The business cards had a link to a survey and no information about humane education. We considered participants to be part of the control group if they used that link and reported not having seen a presentation about factory farming recently. There were 60 participants in the control group. Many people did report having seen such a presentation; we believe that this occurred when cards were given to classes that did not receive a presentation but had overlapping enrollment with classes that did; for instance, when students saw a presentation in science class and received a card in math class. This group of 64 respondents most likely includes mainly students who saw a presentation a short time before filling out the survey.
These sample sizes are fairly small, but because humane education is more expensive to deliver, per person reached, than other outreach methods including leafleting and online methods, we are most interested in whether humane education has a relatively large effect size compared to these methods. Participants were incentivized with entries in a $500 prize drawing; Matthew Grace from Pennsylvania won the prize.
Conversion to Vegetarianism and Veganism
Large studies have shown that a large proportion of people who claim to be vegetarian actually eat some type of meat. Therefore, although our survey asked respondents whether they were vegetarian, we won’t use that question to determine whether we think they were vegetarian. Instead, we use responses to the food frequency questionnaires to find out how many respondents in each group stopped eating specific animal products.
| experimental | control | neither | ||
|---|---|---|---|---|
| red meat | stopped eating | 3 | 1 | 1 |
| started eating | 4 | 0 | 0 | |
| net change | -1 | 1 | 1 | |
| net change (%) | -1% | 2% | 2% | |
| poultry | stopped eating | 5 | 1 | 1 |
| started eating | 3 | 0 | 0 | |
| net change | 2 | 1 | 1 | |
| net change (%) | 1% | 2% | 2% | |
| fish | stopped eating | 5 | 1 | 0 |
| started eating | 6 | 4 | 2 | |
| net change | -1 | -3 | -2 | |
| net change (%) | -1% | -5% | -3% | |
| eggs | stopped eating | 4 | 2 | 0 |
| started eating | 3 | 0 | 1 | |
| net change | 1 | 2 | -1 | |
| net change (%) | 1% | 3% | -2% | |
| dairy | stopped eating | 3 | 0 | 0 |
| started eating | 6 | 0 | 2 | |
| net change | -3 | 0 | -2 | |
| net change (%) | -2% | 0% | -3% |
The differences in percentage change are small and in most cases are in the opposite of the direction we would have predicted if humane education has an effect. In fact, none of the differences are statistically significant even at the lenient 10% level using a chi square test to compare either all three groups or only the treatment and control groups.
We generated 95% bootstrap confidence intervals for the difference in percent net change between the experimental group and the control group. Positive differences indicate that a higher percentage of subjects in the experimental group quit eating a product than in the control group. All intervals contained zero, consistent with the insignificance of our results in the chi square tests. The confidence intervals for red meat, poultry, fish, eggs, and dairy were (-7.4%, 1.8%), (-5.5%, 3.5%), (-3.5%, 13.0%), (-8.8%, 2.4%), and (-5.3%, 1.8%) respectively.
Meat Reduction
Even though it does not appear that attending humane education lectures has a dramatic effect on a student’s likelihood of stopping eating particular animal products, it might have other strong effects. One possibility is that it makes students more likely to try to reduce their consumption of animal products. We are cautious about determining how much reduction has occurred from survey responses as in this study, because while we think respondents can likely remember whether they ate a type of food at all three months ago, they may not be able to remember how often they ate it.
We first analyzed whether treatment or control group membership affected whether respondents reported increasing, decreasing, or maintaining the same frequency of consumption for the animal products on our food frequency questionnaire. We did not find any statistically significant results for individual products, for the average frequency with which all products were consumed, or when considering the labels people used to identify their diets (e.g., by considering people who went from an unspecified diet to a “meat reduction” diet to be reducing their meat consumption).
Next, we analyzed the size of the reported reductions or increases to see whether respondents who had attended a lecture were reporting larger reductions or smaller increases in consumption than respondents in the control group. We used linear models to predict the change in frequency of consumption of each type of product from the group the respondent was categorized in. The only significant relationship was that control group respondents reported larger decreases in egg consumption than respondents in the treatment group (p<.05). It is particularly difficult to determine the frequency with which one eats eggs, because they can be present in a non-obvious way in many foods, such as baked goods, so respondent reports of the frequency of egg consumption are especially unreliable. Combined with the danger that when running many comparisons some will likely be statistically significant by chance, we suspect this result does not represent a significant (in the real world sense) difference between the treatment and control groups.
Additional results
Respondent Characteristics
We analyzed the composition of the treatment and control groups to see whether there were demographic factors that would present problems for the validity of our comparisons. The three groups did not differ significantly in age or gender composition, although members of the third group (neither control nor treatment) were slightly younger on average than members of the other two groups. Throughout the sample, 64% of respondents were female. The respondents ranged in age from 13 to 52, with a median age of 17. Our respondents were geographically concentrated because most presenters work locally; the plurality of respondents in each of the control and treatment groups lived in Georgia.
Attitudes about Diet
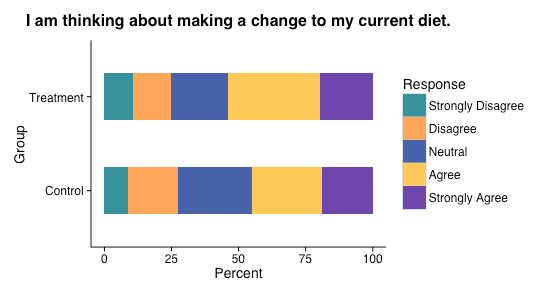
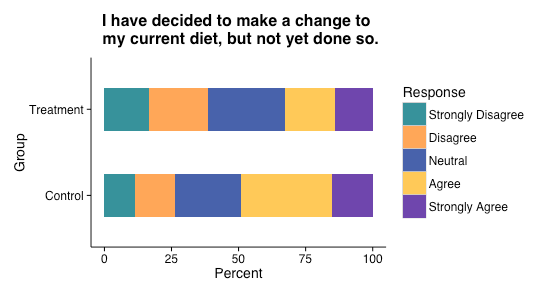
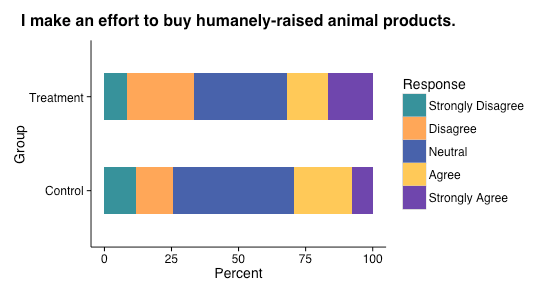
The survey included two statements directly addressing whether respondents intended to make a change in their diet in the future. Control group and treatment group responses to these statements was similar, as shown in the graph below. The survey did not ask what changes respondents intended to make, if any. We did not check differences in control and treatment group responses for statistical significance.
Attitudes about Animals
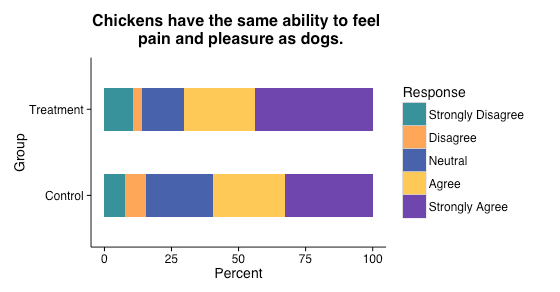
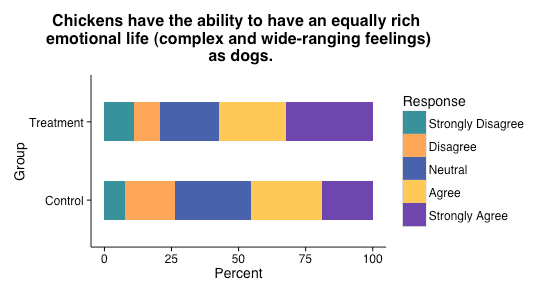
The survey included several statements directly exploring respondents’ attitudes towards animals. We aren’t certain how to interpret these statements in terms of their likely effects for animals and did not check them for statistical significance. Graphs comparing control group and treatment group responses show that a few months after seeing a presentation, respondents were slightly more likely to agree with statements indicating concern for farmed animals.
Conclusions
Humane education programs do not appear to lead to substantial changes in diet that would lead to their being exceptionally cost-effective on that basis alone. Our sample size was not large enough to reliably detect smaller effect sizes, and it is possible that humane education does have a small effect on participants’ diets or a larger effect on a small percentage of participants’ diets. (Power calculations show that we would have had a 60% chance of detecting that the control and treatment groups behaved differently if 9% of the treatment group stopped eating a product and 1% of the control group did, but only a 22% chance of detecting a difference if the treatment group rate dropped to 5%.)
One reason there might be no effect or a small effect on diet is that 61% of respondents in our study were under 18 and likely had to negotiate their food choices with family members. This percentage is representative of the typical audiences our partner organizations present to. Given this situation, humane education may have a delayed effect on diet choices or have most of its effects in other ways that participants express their attitudes towards animals. While we did not find strong indications of a delayed effect on diet, we did see evidence that humane education affects attitudes towards farmed animals. We aren’t sure what that implies on a practical level.
Resources
Survey
Full Dataset
Dataset Interpretation Guide
Statistical Materials and Reports (zip file)
Please note that this report is archived, as it was written in 2013 and is not up to our current standards.
Materials
Official Protocol
Instructions for Presenters
Email Sign-up Sheet
Business Card
Survey
Resources
Survey
Full Dataset
Dataset Interpretation Guide
Statistical Materials and Reports (zip file)