Compensation Strategies Survey Results

Introduction
As ACE has continued to grow as an organization, we have identified a need to revisit a new salary-setting procedure and compensation strategy. Compensation systems influence the behavior of employees and are intended to align individual actions with organizational goals. By communicating messages about an organization’s values and practices to current employees and potential hires, compensation systems can reflect or reinforce organizational culture. Therefore, it has been suggested that compensation strategy and organizational culture are complementary elements in achieving the strategic goals of the organization.1 In order to get insight into the compensation systems of organizations similar to ACE, we conducted an exploratory survey targeting charities within the effective altruism (EA) and animal advocacy movements. We were particularly interested in learning about the tools and processes that other organizations use to set their salaries as well as any recent or upcoming changes to strategies. We also wanted to learn about the attitudes that representatives of organizations have toward pay transparency, employee satisfaction, and talent acquisition and retention.
Table of Contents
Given our small sample size and important limitations regarding survey design, this report by no means provides an exhaustive understanding of compensation strategies within the EA and animal advocacy movements. Rather, it provides preliminary information about the compensation strategies of some charities, opening avenues for further inquiry.
Methods
The survey was administered through SurveyGizmo and was sent on December 19, 2018 via ACE’s Managing Director to 51 individuals, each working at a different charity. The individuals were occupying director, operations, and/or human resource positions, as we believe individuals in these roles are likely to have the most knowledge about their organizations’ compensation practices. To identify survey recipients, we used ACE’s internal list of animal charities and EA organizations, excluding organizations that did not appear to have paid staff or were not independent organizations. We then identified individual contact information for the remaining organizations. Survey results won’t impact ACE’s evaluation of participating organizations and survey recipients were informed accordingly.
The survey had a total of 45 questions. Closed-ended questions were analyzed within SurveyGizmo’s reporting functions. Open-ended responses were coded independently by identifying themes that emerged across responses, then common themes were tabulated.
We received a total of 20 responses representing 20 different organizations (39% response rate). Participants were primarily Executive Directors or equivalent (70%), followed by directors or equivalent (15%). The rest (15%) were operations staff, human resources staff, or board members.
Organizations’ Demographics
More than half of the organizations that responded to the survey were based in the U.S. (55%). Non-U.S. organizations (45%) were based in Brazil, Germany, Canada, the U.K., Poland, or other European countries. Some organizations had a presence in multiple countries.
A majority of organizations had remote employees; 60% were fully remote and 30% were hybrid (with office-based employees and remote employees), while only 10% were co-located (with no remote employees).
Also, a majority had less than 30 employees (45% with 11–30 employees and 40% with 1–10 employees). The rest were distributed between 31–60 employees (5%), 61–100 employees (5%), and more than 100 employees (5%).
Organizations varied in annual operating budget and length of operation:
- 40% had an annual operating budget of 500k USD or less, 25% of 1M–5M USD, 20% of 5M USD or more, and 15% of 500k–1M USD.
- 40% had been in operation for 10+ years, 25% for 2–4 years, 20% for 4–6 and only a few for 0–2 years (15%).
Results
Benefits
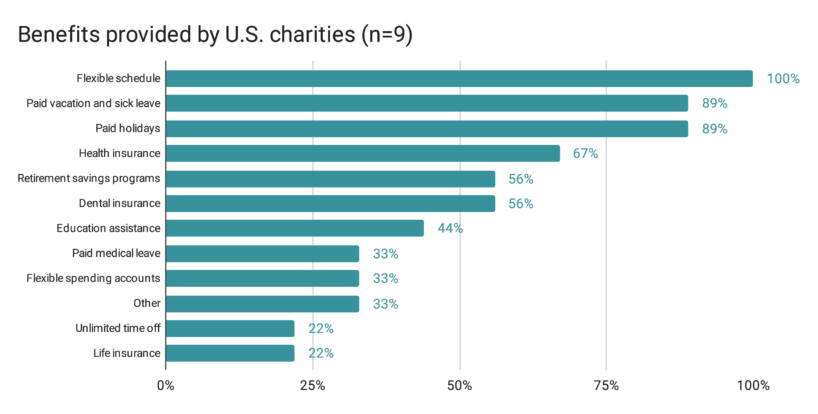
Since many benefits that charities offer to their employees are legally required in the countries in which they operate, we decided to report only the benefits provided by U.S. charities (n=9) in order to make the results more comparable. Note that some states and local jurisdictions may have additional requirements, so results may not necessarily indicate benefits that charities choose to offer voluntarily.
All U.S.-based organizations reported providing flexible schedules to their staff, and almost all of them provide paid vacation, sick leave, and holidays (89%). More than half offer health insurance (67%), retirement savings programs (56%), and dental insurance (56%), while less than half offer education assistance (44%), paid medical leave (33%) and flexible spending accounts (33%). Only two organizations offer unlimited time off and life insurance (22%). Other benefits mentioned (33%) included: paid parental leave, employee assistance program (EAP), companion animal insurance, vision insurance, equipment purchasing assistance, health insurance reimbursement (which differs from health insurance as it only covers a limited amount per month), transit pass, and cell phone costs.
Interns
Most surveyed organizations provide internships (60%, n=12). Of those, 58% (n=7) provide paid internships.2 Of those who do not pay interns, 60% (n=3) do not intend to pay them in the future under the claim that it isn’t worth the cost.3 For instance, one organization explained that by offering both paid and unpaid internships in the past, they found that both pools of applicants were equal in skill. As such, they don’t believe that paying interns is a more important use of marginal funding than undertaking other activities. Those who do not pay interns but intend to do so (40%) cited that they believe that offering compensation will be helpful for recruiting talented interns who may not otherwise be able to take internships.
Development and Iterations of Compensation Strategies
Tools or reports used for developing salary structures
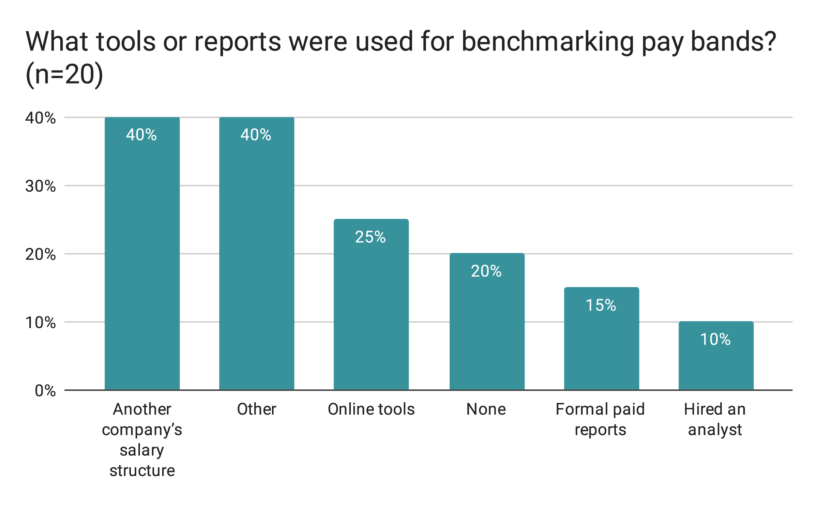
Organizations appear to develop their pay bands in various ways, using multiple resources as benchmarks. The most common method reported to benchmark pay bands was using another company’s salary structure (40%), followed by using online tools such as Salary.com or other published reports (25%), using no method at all (20%),4 using formal paid reports (15%), and hiring an analyst (10%). Other methods mentioned (40%) included using compensation schemes from governmental institutions and other companies, doing an informal survey of salaries for similar roles, and considering the cost of living and minimum wage in different countries.5
Primary factors influencing charities’ choice of compensation strategy
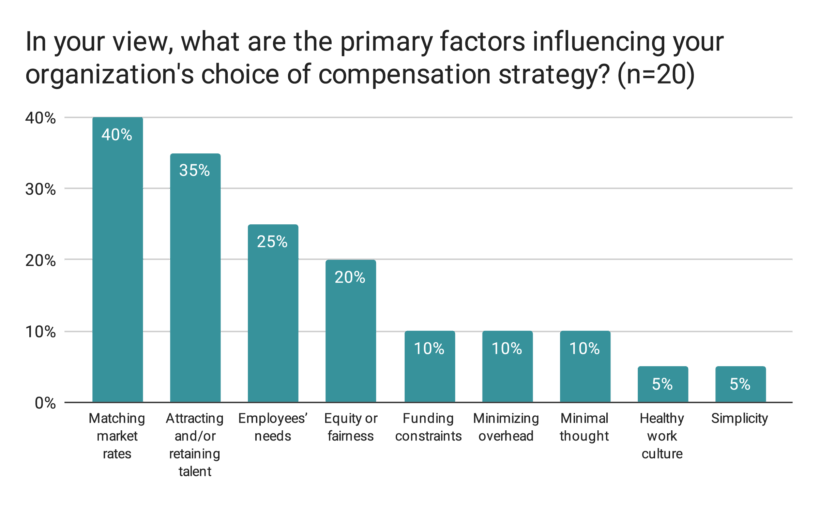
When asked an open-ended question about the primary factors influencing their choice of compensation strategy, matching market rates (40%) and attracting and/or retaining talent (35%) were the top reported factors, followed by meeting individual employee needs (25%), and equity or fairness (20%). Other factors included having funding constraints (10%), minimizing overhead (10%), giving minimal thought (10%), promoting a healthy work culture (5%), and keeping it simple (5%).
Factors for consideration in determining salary for new hires
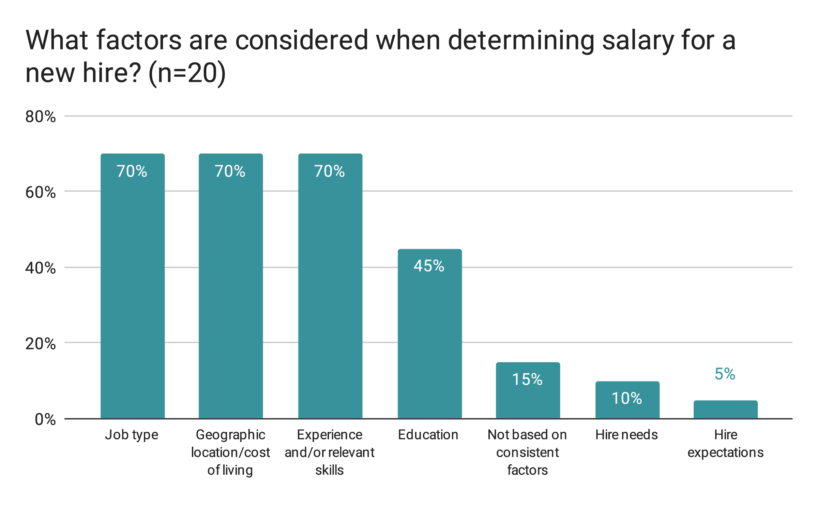
When determining the salary for a new hire, the most common factors reported were job type (70%), geographic location/cost of living (70%), and experience and/or relevant skills (70%). Less than half reported educational background as figuring into salary determination (45%), and a few reported the hire’s needs (10%) and expectations (5%), while others responded that they do not base their decisions on consistent factors (15%).
Of those that indicated having a hybrid location model (some remote employees, some working from the same location), 33% said that salaries for remote employees are determined differently. Of those, half specified that they get paid more to make up for not receiving the same benefits that non-remote employees receive, including healthcare and retirement contributions, and half said that they are paid less as working remotely is considered a perk.
Salary determination of current and new Executive Director
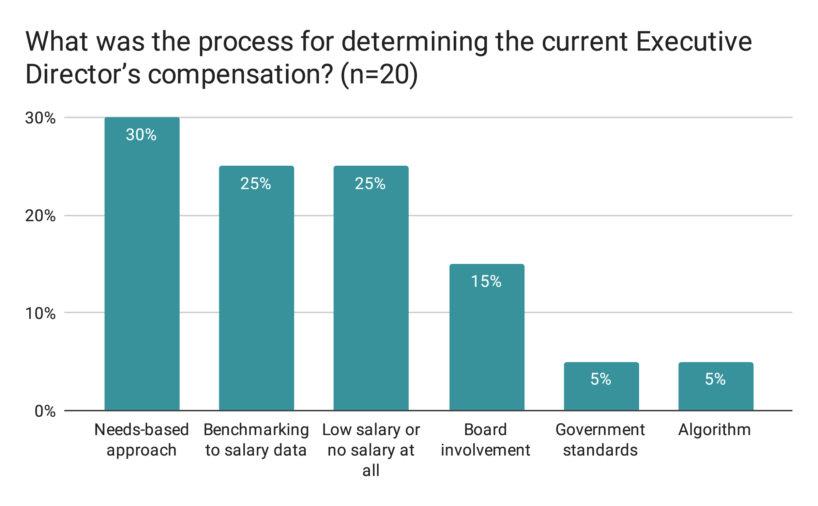
There didn’t seem to be a prevailing approach to determining the current Executive Director’s (ED) salary, although 30% expressed a needs-based approach, 25% reported benchmarking to salary data, and 25% mentioned taking a low salary or no salary at all. Other approaches included the salary being set by the board (15%), based on government standards (5%), or determined by an algorithm (5%).
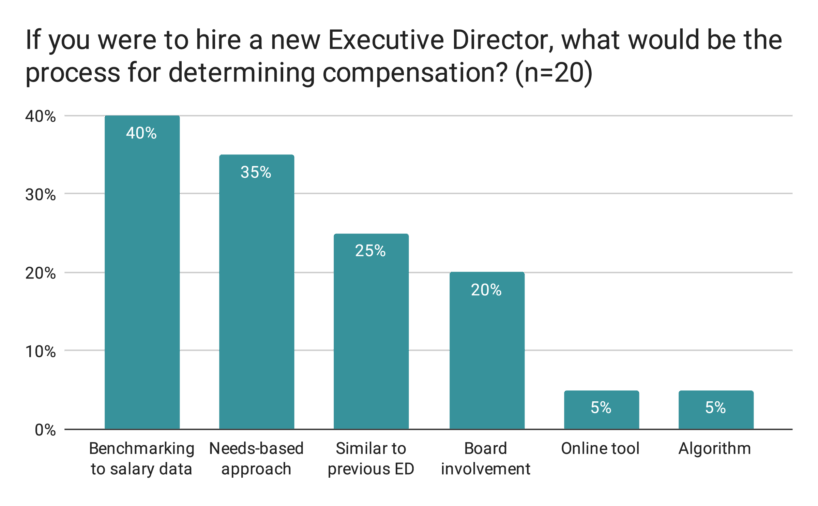
In the case for determining compensation if a new ED was hired, 40% said their approach would include benchmarking to salary data, 35% would consider the needs of the hire, 25% would use a similar method to the previous ED hire, and 20% would involve the board. Only one organization would use online tools (5%) and another would use an algorithm (5%).
Raises
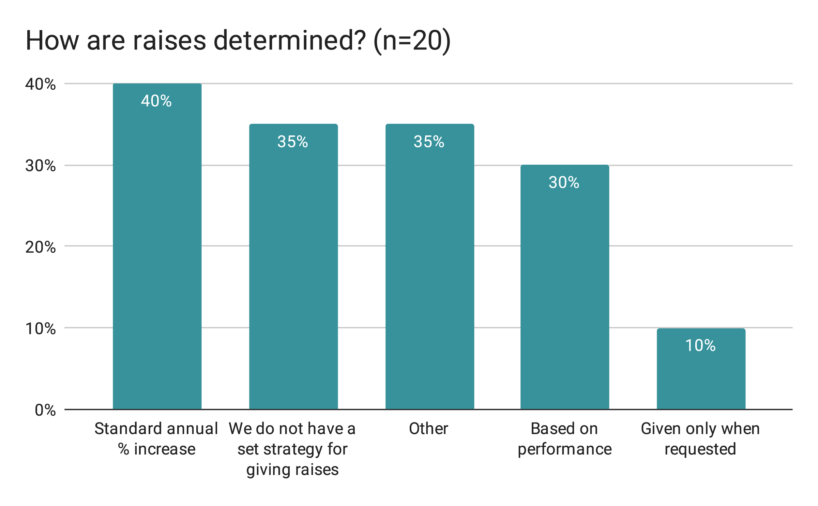
Surveyed organizations determined raises in different ways: Most reported using an annual salary % increase (40%), yet more than a third did not have a set strategy for giving raises (35%). Some organizations determine raises based on employees’ performance (30%) while only a few give raises only when requested (10%). Other responses (35%) included regularly asking staff if they need a raise, giving raises for length of service, and considering the organization’s funding.
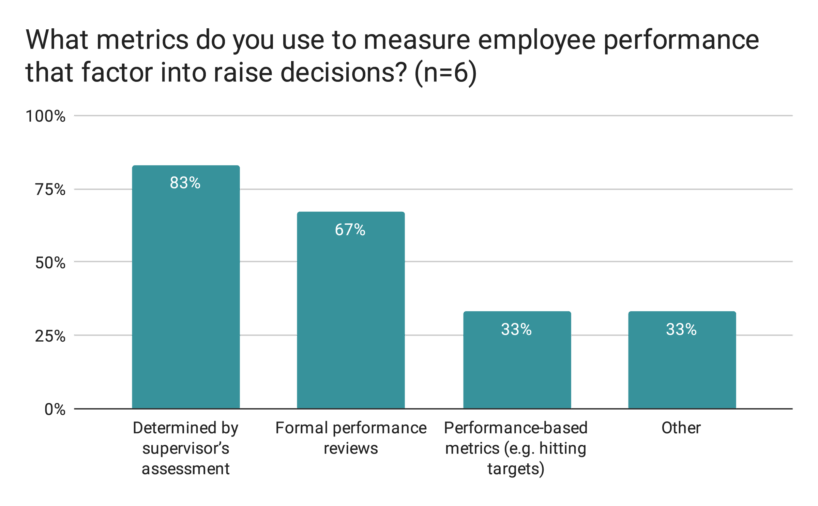
Most of those who use a performance-based approach determine raises based on supervisors’ assessment (83%) and use formal performance reviews (67%). Two organizations use performance-based metrics such as hitting targets (33%). Other responses (33%) included using performance journals and not using consistent factors.
Reviewing compensation packages
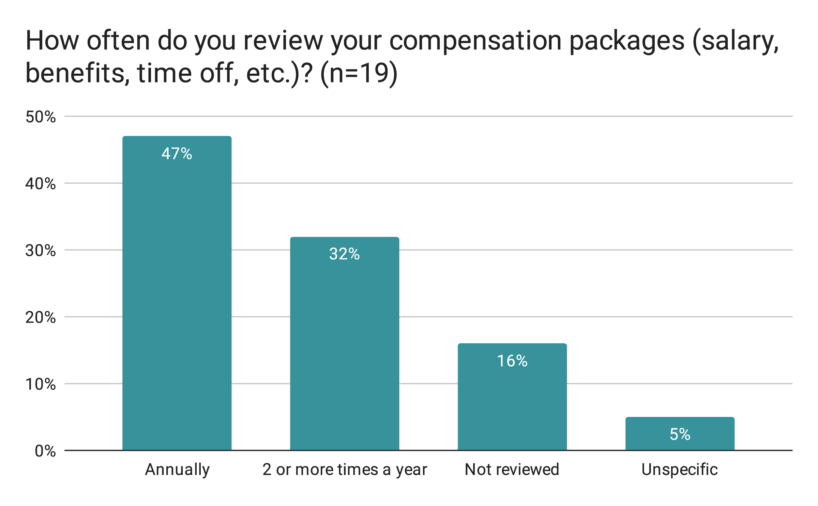
Most organizations review their compensation packages (e.g. salaries, benefits, etc.) every year (47%) or multiple times a year (32%). A few had not reviewed their compensation because of their small size or recency of foundation (16%). One response was unspecific (5%).
Recent or upcoming changes
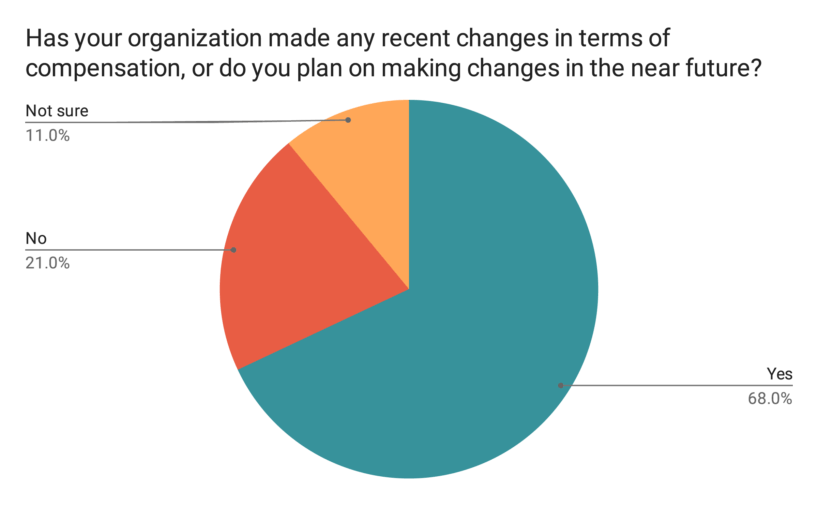
Most respondents said they have made recent changes or are planning to make changes to their compensation structure in the near future (68%).
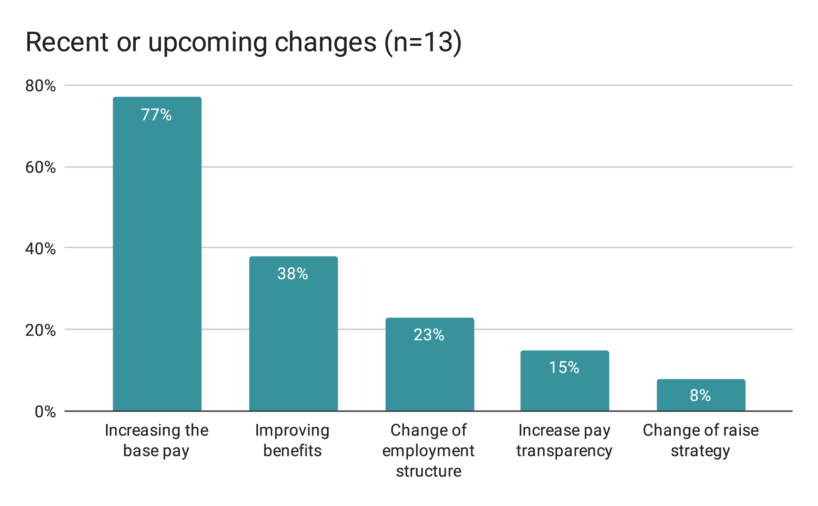
Of those that have made (or plan to make) recent changes in compensation, by far the most reported change was increasing base pay (77%), followed by improving benefits (38%) and making changes to employment structure (23%)—for instance, moving all employees from contract to full-time, and decreasing the workweek from 40 to 30 hours while maintaining the same pay. Only 15% reported making changes to increase pay transparency within their organization, and one (8%) mentioned a change to their raise strategy.
Recruitment and Retention
Over half of the participants suggested that a change in their organization’s compensation strategy would help the organization’s ability to attract talent (55%), a minority suggested it would not (35%), and a couple were not sure (10%).
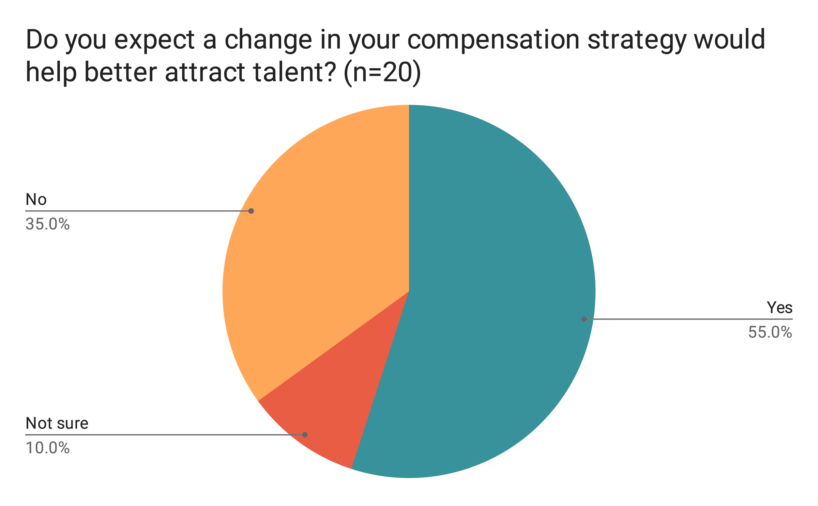
Some of those who didn’t expect changes in their compensation strategy to help attract better talent (35%) expressed that they are able to attract candidates who are interested in working for the cause, not for the salary.6 One respondent noted that they have been able to develop the talent of their volunteer base into staff (and therefore do not need to rely on open recruitment), and another reported that as their roles are often “values sensitive”: Those who seek higher salaries are generally less aligned with the work. Note that two participants responded that they were not sure.
Opinions about whether a change in the organization’s compensation strategy would help retain existing talent were divided among respondents (39% indicated yes and 39% indicated no), and 22% were not sure. Note that two participants did not respond to this question.
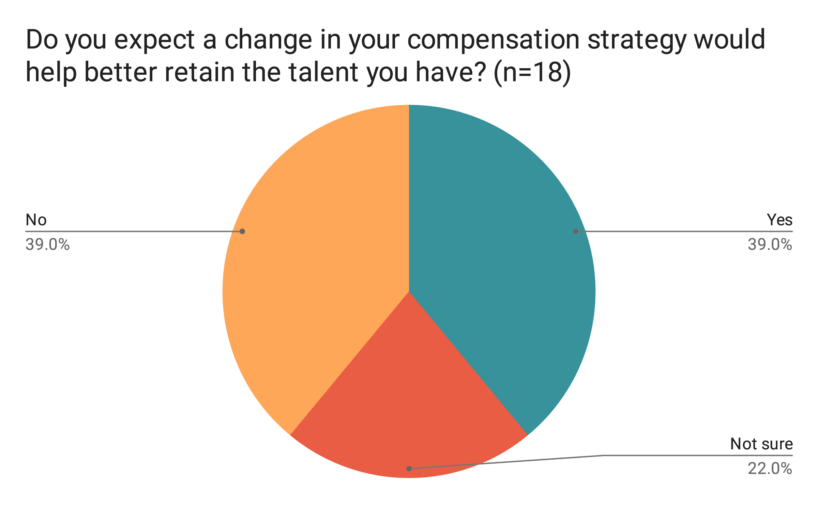
Some of those who did not expect that a change in their organization’s compensation strategy would help retain talent noted that they do not experience retention issues or that the flexibility of their structure would prevent people from leaving for salary-related reasons.
Employee Satisfaction
Three-quarters of respondents (75%) said they think their employees are satisfied with their compensation.7 Yet 65% also said they believe their organization’s staff should be compensated more, all mentioning funding constraints as the primary barrier. One participant mentioned resistance from the board and another mentioned resistance from leadership.
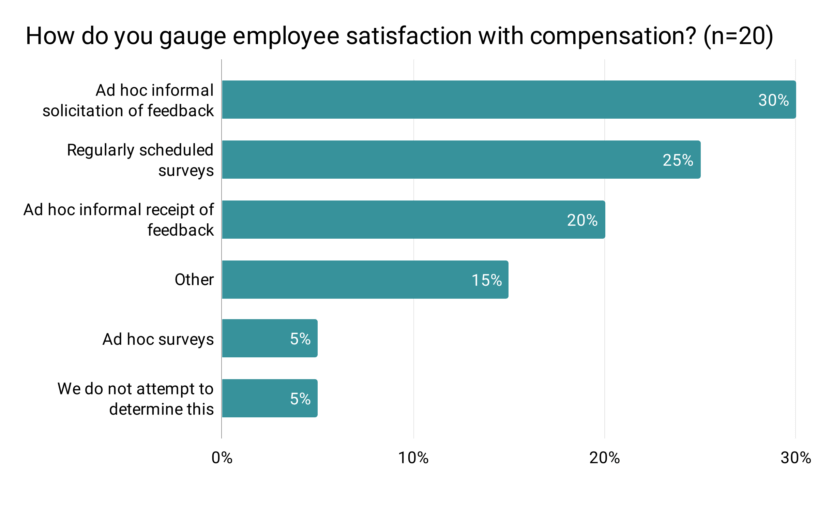
Organizations use different methods to gauge employee satisfaction with compensation. The most commonly reported method was informally asking for feedback (30%), followed by doing regularly scheduled surveys (25%), and considering feedback when given (20%). Only one organization does ad hoc surveys (5%) and another does not attempt to determine employee satisfaction (5%). Others (15%) mentioned having a formal biannual feedback process and checking in with all employees personally.
Pay Equity and Pay Transparency
Pay equity
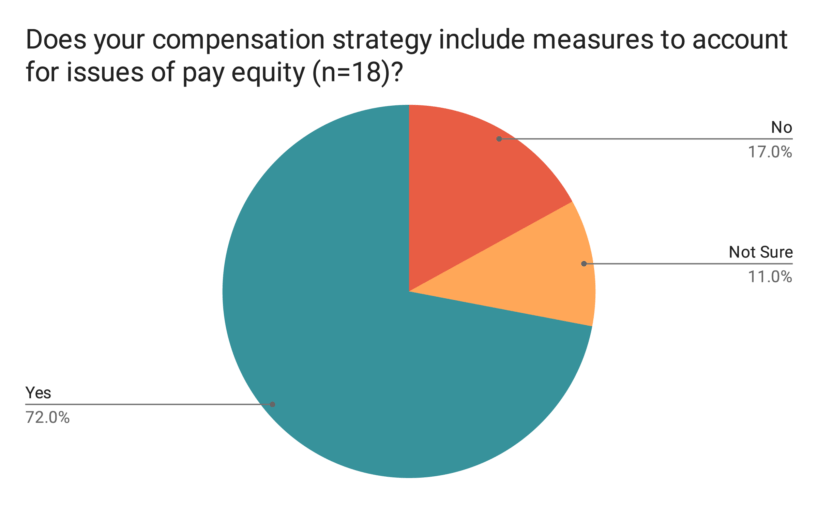
When asked whether their compensation strategy includes measures to account for issues of pay equity (where “pay equity” refers to equal pay for equal work), a large majority of respondents said yes (72%), and only a few responded no (17%) or were not sure (11%).8 Note that two participants did not respond to this question.
Pay transparency
Our survey defined six levels of pay transparency:
- Full internal and external transparency (everyone inside and outside of the organization has access to what employees are making)
- Full internal transparency (everyone inside the organization has access to what all employees are making)
- Semi-transparent (everyone inside the organization has access to the pay bands for all or most roles)
- Some transparency (everyone inside the organization has access to what some employees are making, but not others)
- Little or no transparency (no disclosure of pay or pay ranges to all employees, except for HR and upper management)
- No transparency (no disclosure of pay)
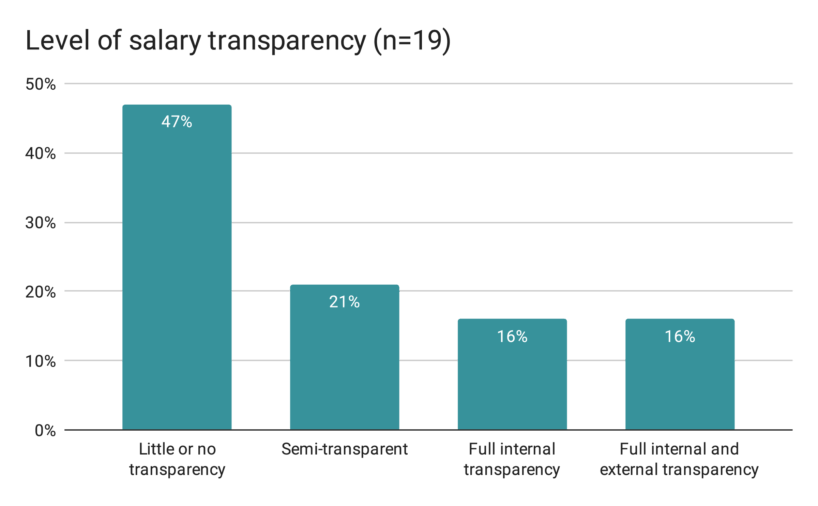
When asked about which of these best describes the level of pay transparency at their organization, 47% reported little or no pay transparency, 21% reported semi-transparency, 16% reported full internal transparency, and 16% reported full internal and external transparency.
We also asked participants about their thoughts on internal transparency. The majority expressed being in favor of internal transparency (58%), 32% expressed ambivalence, and 10% expressed being against it.9
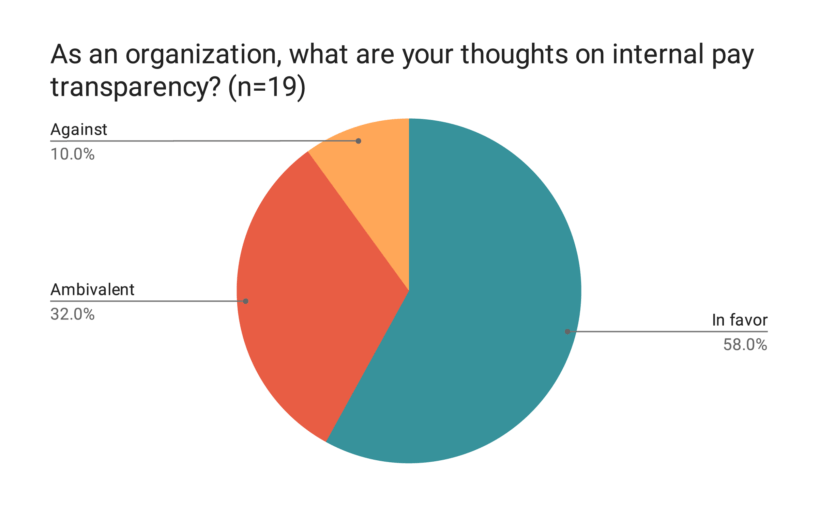
Many of those who responded in favor of internal transparency said it is a beneficial strategy for facilitating equity and fairness. For instance, one respondent explained that transparent salaries can prevent the misuse of power by leaders or protect against preferential treatment, and others cited that transparency is good for social dynamics (providing that what it shows is fair).
Some respondents who expressed ambivalence or negative attitudes toward pay transparency expressed concern that individual privacy might be directly or indirectly compromised, whereas others expressed a desire for more evidence on the strategy’s effectiveness.
Interesting Findings
Needs-Based Approach
A common finding in our research was a needs-based approach to determining compensation. It was mentioned as a primary factor influencing the choice of compensation strategy by 25% of respondents. It was also noted as the approach used to determine the salary of the current Executive Director or a future Executive Director by 30 and 35%, respectively. This suggests that although it is not held by a majority, there is a portion of organizations (25%–35%) that uses a needs-based compensation strategy.
This strategy considers individuals’ salary needs on a case-by-case basis rather than on hierarchy and job description across all employees, as is traditionally done within both for-profit and nonprofit organizations. One of the primary benefits of this approach is that it accommodates different levels of financial needs dependent on individual circumstances, ideally eliminating salary concerns and allowing employees to focus on work. This requires each employee to individually determine what they need given their circumstances, such as the cost of living in their geographic area and/or whether they have dependents or debt. (One organization we surveyed noted that some junior staff were paid more than senior staff due to having student debt to pay.)
While a needs-based strategy has merits by ensuring each individual’s financial needs are met equally, we think this strategy may be insufficient for ensuring inequalities do not arise. Pay equity on a needs-based model is difficult to address as it aims to look at need on a case-by-case basis, and not across all employees. Using this model, it seems difficult to control for group differences in how individuals represent their salary needs, which could, in turn, lead to inequities (i.e. certain groups may systematically expect and therefore ask for higher or lower pay). Additional challenges with this approach include ambiguity in what constitutes a “need” (e.g. some may consider living in a high cost-of-living city a need, whereas others may consider it a choice).
Pay Transparency
Another noteworthy finding is the difference between the respondents who express support for internal pay transparency (58%) and the organizations that have implemented it (16%). This may reflect a social desirability bias10 or a lack of capacity to implement practices; barriers to increasing salary transparency include the need to bring salaries into alignment before publishing, a lack of sufficient information regarding the effectiveness or benefits of pay transparency, and legal barriers in the countries the organizations are based in (as reported by one organization we surveyed). Additionally, 15% of respondents said they have recently made or will be making changes to increase pay transparency within their organization, possibly offering a partial explanation as to why actual transparency is lower than support for it.
ACE believes pay transparency is something to strive for, but we acknowledge that implementing this policy may not be as simple as revealing all salaries as they are. Rather, transparency likely needs to be implemented as part of a greater salary strategy involving making the salary determination process itself transparent and fair and bringing any misaligned salaries into alignment.11 There is a risk in revealing salaries too soon if there are any existing inequities that may cause upset among employees and consequences for teamwork and motivation.12
For some, a needs-based strategy is seen as being less compatible (though not always) with pay transparency, as differences in salary reveal differences in needs that may compromise personal privacy and/or cause discord among staff. This is consistent with research that suggests that it is important for employees to know that their salary is fair in comparison to their peers.13 We are interested to learn more about organizations that have a needs-based salary strategy—or an otherwise atypical or asymmetrical salary structure—that also maintain transparency. We are particularly interested in the effects of this combination on employee satisfaction and motivation.
Interns
Over half of the organizations surveyed provide internships, and just over half of those provide paid internships, with a couple more intending to implement intern compensation in the near future. Two of the organizations surveyed reported that they don’t believe the cost of paying an intern to be worth the marginal use of funding. While we think the cost-effectiveness of paying interns is worth further exploration, we are concerned that unpaid internships may hinder fair access to the positions for people from different socio-economic backgrounds.
Currently, ACE offers a stipend of $1,500 per month for interns working a minimum of 20 hours/week and with legal residence in the U.S., Canada, the U.K., or Germany.14 We feel it is important to provide interns with compensation for their work in order to ensure that our internship opportunities are made available to people of varying backgrounds. We believe that compensating interns contributes to the diversification and growth of the effective animal advocacy (EAA) movement.
Employee Satisfaction
Three quarters of respondents (75%) said they think their employees are satisfied with their compensation. However, 65% also said that as an organization, they believe their staff should be compensated more. Granting that we do not know how accurate respondents’ assessments are of employees’ level of satisfaction with their pay, this is still an interesting finding that might speak to an assumption by leadership that employees have (or must have) low expectations for pay. As noted by some respondents, because they are working in a mission-driven field, leadership expects that employees are prepared to sacrifice some salary in support of the organization’s mission. Although this might be true, we are concerned that this assumption could lead organizations to implement compensation strategies that might exclude people from marginalized socio-economic backgrounds who would not be able to meet their needs with relatively low salaries and few benefits.
As survey respondents were primarily Executive Directors, it’s notable that more than half believe their employees should be paid more (and therefore presumably would like to pay them more) which could point to funding constraints, pressure to keep overhead costs low in order to maximize impact, and/or a social desirability bias.
Role of Compensation in Recruitment and Retention
Our survey did not reflect strong findings on whether organizations expected a change in their compensation strategy to help with their recruitment or retention efforts. However, about a third of participants expected that a change would not make a difference with recruitment (35%) or retention (39%).
In terms of recruitment, many expressed that the organization’s mission is what attracts talent, rather than the pay. Although it might be true that most individuals are drawn to EA and/or animal advocacy for value-based reasons, we are concerned that this claim could lead to the assumption that people who demand higher salaries do not care enough about the cause. As mentioned above, we are concerned that this assumption can be reflected in practices that could exclude people from marginalized socio-economic backgrounds, failing to promote fair labor and diversity of viewpoints in the EAA movement.
Limitations
There are several possible sources of bias we could expect to arise in a survey of this nature. The fact that ACE reviews animal charities and influences funding to them can be a source of both selection bias and social desirability bias. The response rate was relatively low (39%), which may reflect a selection bias, as those who are unhappy with their compensation strategy may have been less likely to complete the survey. Also, the survey may reflect a social desirability bias since participants, who were all in leadership positions, may have been inclined to respond in a way that is viewed favorably by ACE. While our survey did contain a disclaimer that the information provided would not affect whether or not ACE reviews the charity or how we review the charity, we acknowledge the possibility of a social desirability bias from animal charities that responded. Some questions (e.g. the questions about pay equity, employee satisfaction, and pay transparency) are particularly susceptible to social desirability bias because some answers are clearly perceived as socially undesirable.
Apart from these possible biases, we have identified issues regarding survey design which have limited the analysis of our data. Because of a lack of clarity in our questions, we decided to exclude the salary data of charities’ staff and interns from our analysis. Survey questions on highest and lowest salaries didn’t ask respondents to specify staff location, so data didn’t account for differences in cost of living. Also, we didn’t ask for specific salaries for roles as we suspected organizations would be unlikely to give specific information, so we did not have a good sense of how salaries compare to other organizations. We did have ranges of highest and lowest paid salaries but the ranges we provided for these questions were too broad, probably making the difference between the highest and lowest salary look larger or smaller than they actually are. If asking these questions in future surveys, ranges should be narrower and respondents should specify staff location. Because of similar problems with survey design, we also decided to exclude information about interns’ pay rates Our question didn’t specify how to report intern pay, so some responses were reported as hourly while others were reported as weekly, without specifying the number of hours worked per week. A future survey would specify units or provide discrete values to select from and could include interns’ locations to determine whether organizations are paying minimum and living wages. In addition, our questions about benefits and internships offered by organizations did not specify whether decisions regarding these issues were legally required or made voluntarily.
Other cases of design issues included the question about where the organization is based and the question about the tools used for developing salary structures. The first did not directly prompt organizations to specify if they have more than one base, nor did it ask what other countries the organization has employees in. A future survey could include a field to indicate whether an organization is based in multiple locations, and if so, where. The second question implied that pay bands were being used for salary determination, but not all surveyed organizations use pay bands. This assumption built into the questioning may have skewed the results.
One of the aims of this survey was to compare compensation practices and strategies between EA and animal charities. However, given the small size of our sample and the fact that 45% of organizations identified as both effective altruism and animal advocacy organizations, we decided to exclude such data from our analysis.15
Directions for Future Research
We believe the following areas could warrant future research:
Individual salaries within EA and EAA organizations
GuideStar provides salary information for animal-related charities, but the data includes a broad spectrum of animal initiatives. It could be useful to gather specific compensation data across different roles in EA organizations to get a sense of how compensation in EA and EAA groups compares to other nonprofits and the private sector. We expect that this type of research could inspire a fruitful conversation about effectiveness in compensation strategies. Before pursuing this research, we would need to determine if soliciting information on individual salaries would be well-received within the movements.
Pay equity measures
As mentioned, 75% of surveyed organizations indicated that their compensation strategy includes measures to account for pay equity, but we don’t know what these are. Further research into what these measures include could be helpful for understanding how EA and EAA organizations are approaching pay equity.
Needs-based salary, pay equity, and pay transparency
We think it would be beneficial to understand if organizations with a needs-based compensation strategy can effectively ensure pay equity. Several respondents expressed that a needs-based strategy may not be compatible with a transparency policy; we would like to further consider if this is the case, or if there is a model within which the two strategies can effectively operate together.
Effectiveness research on pay transparency
We would like to further our understanding of the short- and long-term impacts of implementing a pay transparency policy (internal and/or external) in terms of cost, recruitment and retention, administrative burden, employee satisfaction and performance, and team morale.
Compensation research for remote teams
We would have liked to collect more information about how remote and hybrid teams are distributed and how differences in cost of living, health care, and different laws and regulations in respective geographic regions factor into compensation strategy. As ACE is an entirely remote team with employees in multiple countries, these considerations are relevant for our own compensation strategy, and we believe they would be useful for others as well. We only asked organizations with remote teams how they determine salary for remote employees, but did not specifically ask how different geographic locations factored into salary decisions for entirely remote teams. Considering the relatively high number of surveyed organizations being on entirely remote teams, we think this is an issue worth exploring.
Paid and unpaid internships
While we collected some information on this subject, there is space for further exploration. This is especially true given the fact that more than half of the surveyed organizations reported having interns, and there was a split on whether interns are paid. Beyond the direct level of skill that organizations are able to attract with paid or unpaid internships, it would be interesting to understand other adjacent effects of paid internships on movement building, including movement diversification and retention.
A better fit for this research
Since some of the surveyed organizations may want to undergo evaluation by ACE, it may not be possible to completely eliminate the resulting social desirability bias. New research might be less subject to social desirability bias if it is not carried out by ACE.
Appendix
See the full questionnaire here.
Madhani, P. M. (2014). Aligning compensation systems with organization culture. Compensation & Benefits Review, 46(2), 103-115.
Note that it is possible that some countries do not allow unpaid internships, and therefore results may not indicate organizations’ voluntary decisions to offer paid internships.
This reason was given by two respondents. The other respondent said that following legal requirements, the type of internship they offer is unpaid while most of their volunteers are paid.
The wording of this question may have skewed results by implying the use of pay bands (see Limitations).
Note that cost of living can vary by city and organizations operating across multiple cities may or may not take those factors into account when deciding on compensation plans.
We have some concerns about the possible implications of this claim and similar claims on inclusion and diversity (see Interesting Findings).
This response is likely to be influenced by social desirability bias (see Limitations).
This response is likely to be influenced by social desirability bias (see Limitations).
This response is likely to be influenced by social desirability bias (see Limitations).
See Limitations.
Trotter, R. G., et al. (2017). The new age of pay transparency. Business Horizons, 60(4), 529-539.
Zenger, T. (2016, September 30). The case against pay transparency. Harvard Business Review. Retrieved from https://hbr.org/2016/09/the-case-against-pay-transparency
Hartmann, F., & Slapničar, S. (2012). Pay fairness and intrinsic motivation: the role of pay transparency. The International journal of human resource management, 23(20), 4283-4300.
ACE offers $1,500/month by default and gives interns an opportunity to request a lower stipend if they choose to.
Note that 20% of the surveyed charities identified as animal charities only, 10% as effective altruism organizations only, and 25% as neither.
About ACE Team
Our compassionate team of researchers, communicators, advocates, and experts come from all over the world. We're united by our shared goal to reduce animal suffering and use evidence and reason to guide our efforts. Together, we write to reflect on our work, share what we're learning, and support a world where all animals can flourish.
ACE is dedicated to creating a world where all animals can thrive, regardless of their species. We take the guesswork out of supporting animal advocacy by directing funds toward the most impactful charities and programs, based on evidence and research.
Join our newsletter


