Effects of Farmed Animal Advocacy Messaging on Attitudes Towards Policies and Decisions Affecting Wild Animal Suffering
In evaluating the effectiveness of farmed animal advocacy messaging, it’s important to take into account the potential impact on attitudes relevant to wild animals. As an example, consider the ways in which typical farmed animal advocacy messages might influence opinions about the provision of pain-relieving medication to elephants who are in the final stages of giving birth. We think it is possible that people exposed to an ‘environmentally-focused’ farmed animal advocacy message may be more likely to oppose providing this pain relieving medication, as the environmental message may cause them to place greater value on non-interference in nature.1 In contrast, people exposed to a ‘cruelty-focused’ farmed animal advocacy message may be more likely to support the provision of that medication, as the cruelty message may cause them to have greater empathy for non-human animals. More generally, we hypothesize that messages highlighting environmental issues could decrease support for actions that are likely to reduce Wild Animal Suffering (WAS), while messages highlighting the cruelty inflicted upon farmed animals could increase support for actions that probably reduce WAS.
The effects of farmed animal advocacy messages on attitudes relevant to WAS are potentially very important, as there are an immense number of wild animals. Thus far, however, views about what these effects could be have been guided by little experimental evidence. In this post we report the results of a randomized controlled trial we conducted that investigated the impact of different meat reduction appeals on attitudes towards policies and decisions affecting WAS.2 We feel that this study had some important limitations and as a consequence we place only a small amount of weight on its results. Despite these limitations we still find the results useful. Contrary to our hypotheses, respondents shown an animal cruelty message actually indicated greater support for habitat quantities likely to increase WAS than those shown the environmental message. The remainder of this post will briefly offer further summary of the study’s methodology, results, and conclusions.
Method
We recruited approximately six hundred participants for this study using Amazon’s Mechanical Turk. All participants were shown a paragraph arguing that the effect of our actions on wild animals “ought to be considered” and that “wild animals may not have lives worth living.” After reading this paragraph, participants were randomly assigned to one of three groups.
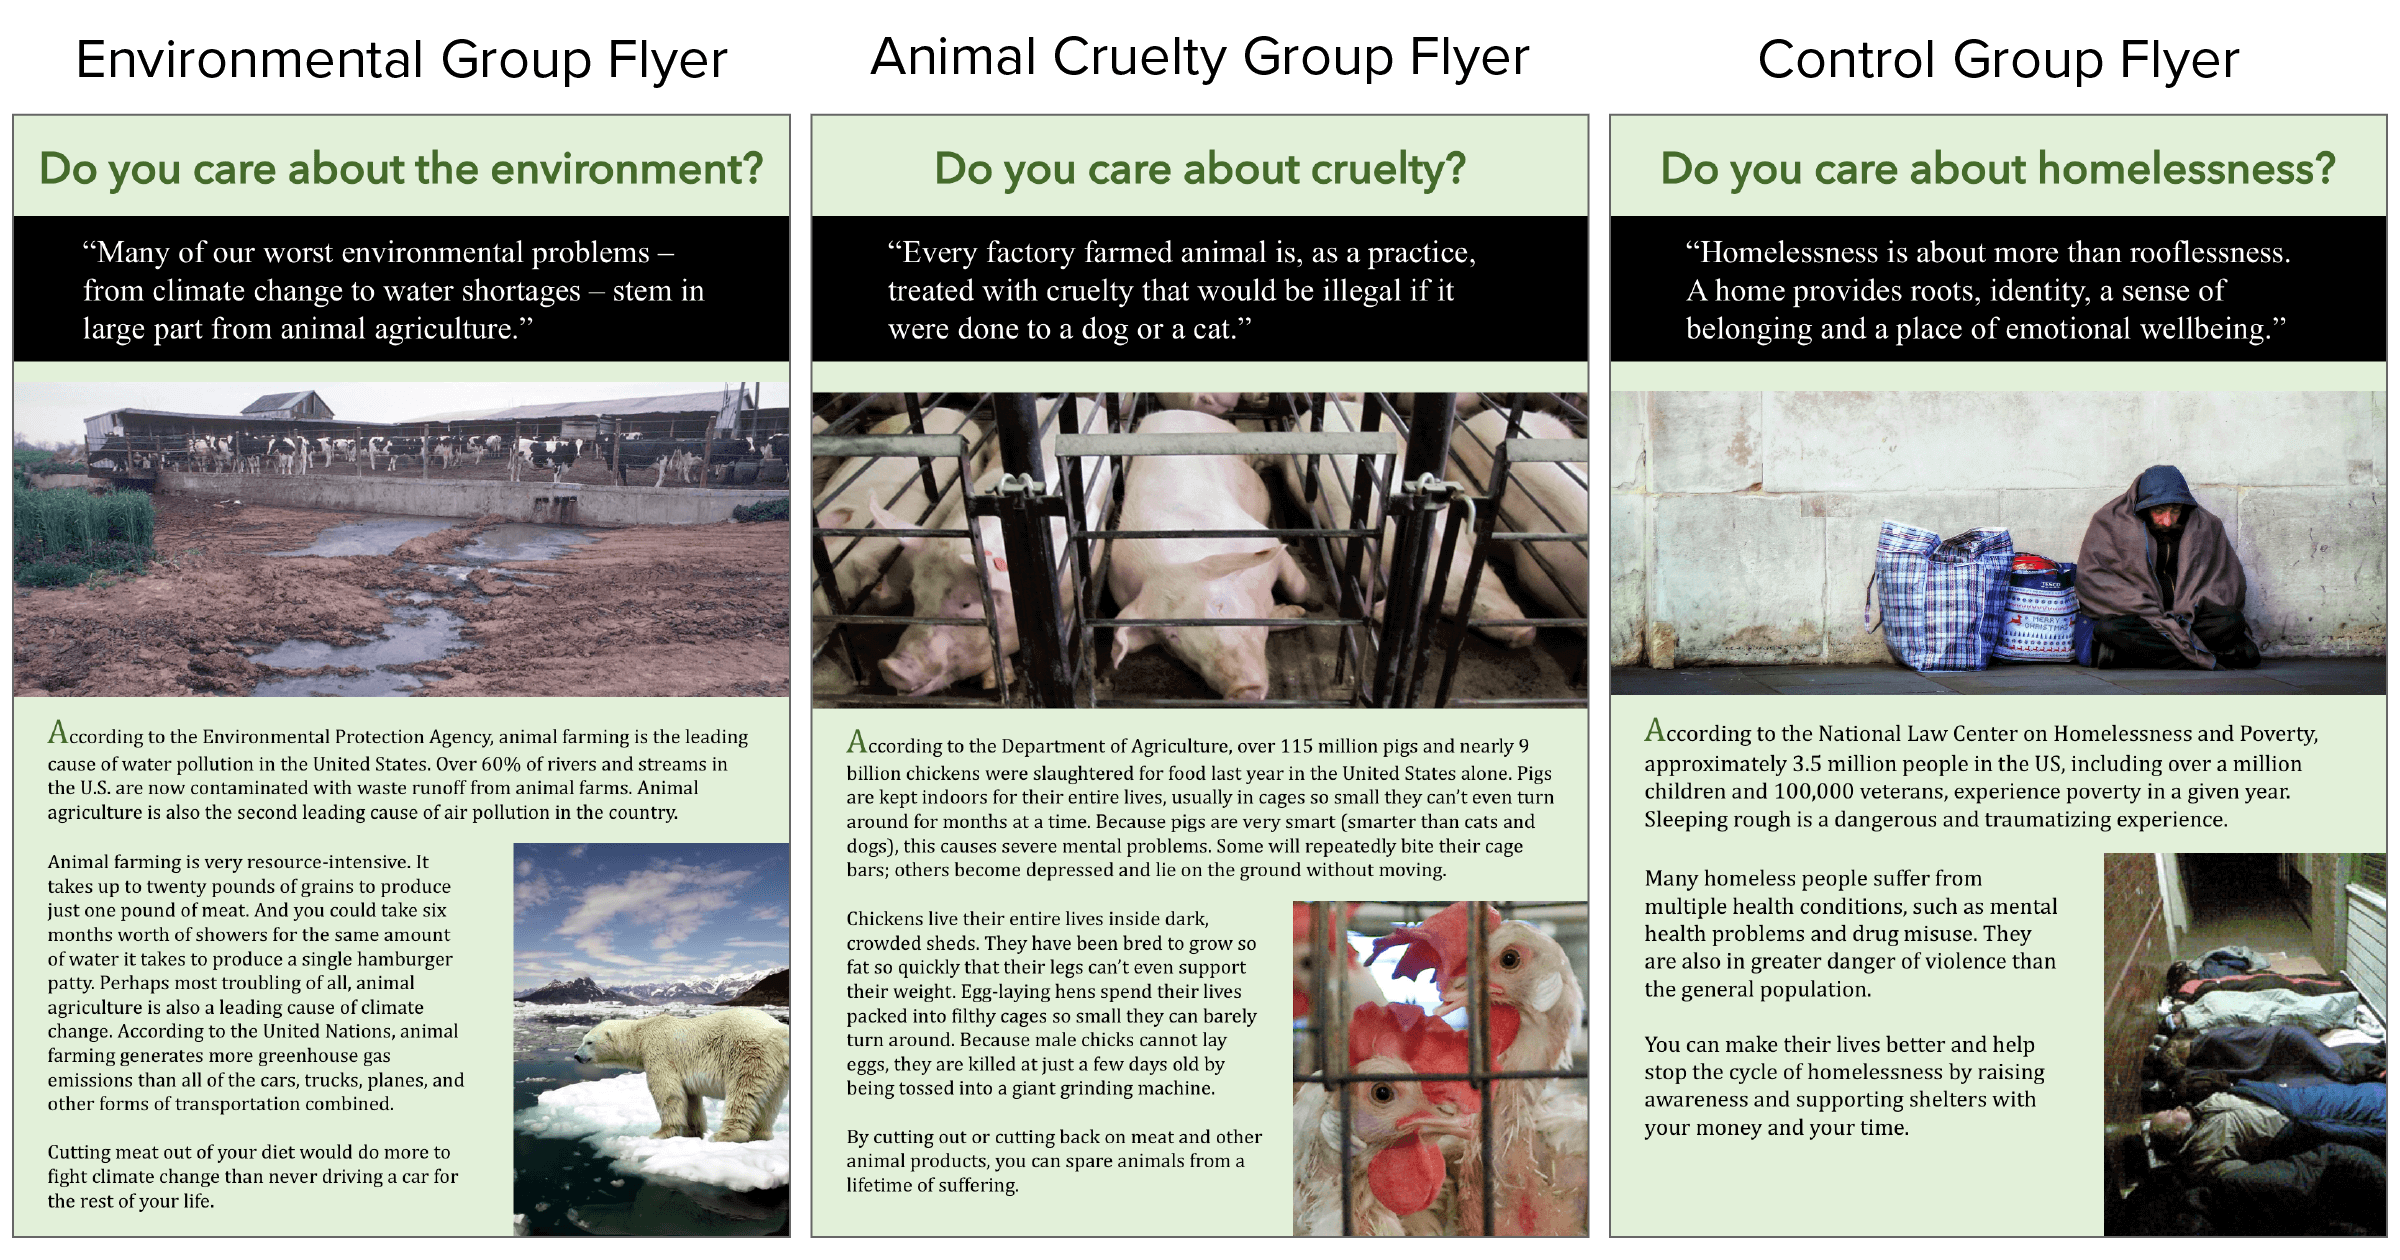
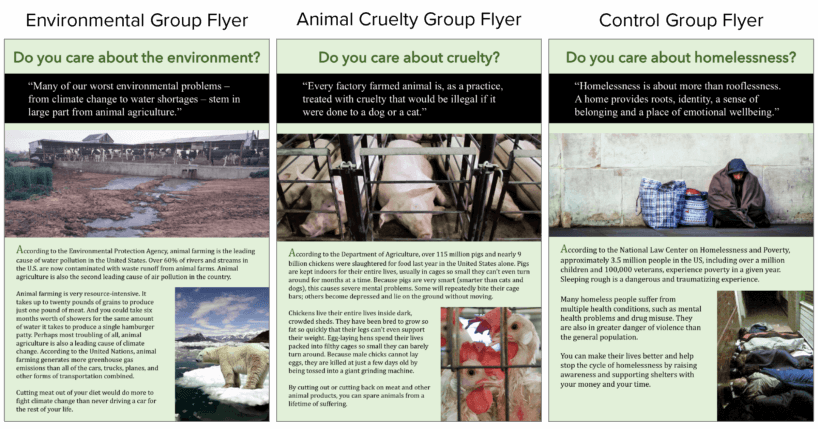
The Environmental Group: Participants in this group were shown a flyer that described the environmental damage associated with animal agriculture, and stated that this damage could be decreased if the reader were to cut meat out of their diet.
The Animal Cruelty Group: Participants in this group were shown a flyer that described the suffering endured by farmed animals, and stated that animals would be spared those harms if the reader were to cut out or cut back on meat.
The Control Group: Participants in this group were shown a control flyer that advocated for volunteering at and donating to homeless shelters.
After having time to read these flyers, participants completed a twenty-one question survey assessing their attitudes towards policies and decisions affecting WAS. The questions in this survey addressed a wide range of topics, including the destruction and restoration of habitat, helping individual wild animals, and providing birth control in order to avoid starvation and illnesses. The full list of questions is available here.

In a previous study, we asked participants3 to respond to several WAS related policy questions and observed that the correlations between these questions were lower than we would have expected for a unidimensional construct, suggesting that attitudes towards policies affecting WAS might actually be a multidimensional construct. A multidimensional construct is composed of multiple constructs that are unidimensional and grouped together into one overall concept.4 For instance, job satisfaction is a multidimensional construct because the concept is a combination of satisfaction with the multiple facets of a job (e.g., satisfaction with self-perceived competence, satisfaction with salary level, etc.). Similarly, attitudes towards policies affecting WAS may be multidimensional because the concept could be composed of multiple distinct unidimensional constructs (e.g., attitudes towards the preservation of nature, attitudes towards helping an individual wild animal, etc.).
Thus, prior to conducting our main analyses, we conducted an Exploratory Factor Analysis (EFA) of the WAS items. EFA is used to identify dimensions from the responses to a questionnaire on a multidimensional construct by examining the correlations in the question responses in order to find how many dimensions explain a substantial amount of response variance. EFA performs a regression to determine the correlation between each question and each of those dimensions. The Researcher then attempts to use the correlations between different questions and the identified dimensions to interpret what each dimension represents.
Results
As expected, we did observe multidimensionality in our WAS items. Specifically, we observed that five dimensions accounted for 38.4% of the variance in responses. For the interpretation, individual items were allowed to correlate with multiple dimensions, and correlations greater than an absolute value of 0.3 were judged to be significant.5
Based on the content of the items loading onto each of these dimensions, we interpreted the dimensions as follows:
- The first dimension was about “preferences for more habitat.” Responses to the following item had a strong correlation with this dimension: “In some rural Brazilian areas, logging destroys the habitat of the poison dart frog while also substantially benefitting the local economy. Much of the timber on the market in America is said to come from these rural Brazilian areas. Would you support or oppose an environmentalist group’s proposed boycott of timber products to make the extinction of the poison dart frog less likely?”
- The second dimension was about “preferences for reducing the suffering of a population of wild animals.” Responses to the following item had a strong correlation with this dimension: “A wildlife park in Africa is considering implementing a policy that would give all elephants in labor pain-relieving medication to dull the intense pain that can come with giving birth. Would you support or oppose this policy?”
- The third dimension was about “preferences for saving an individual wild animal.” Responses to the following item had a strong correlation with this dimension: “Suppose rangers on a wildlife preserve come across a deer that has been injured by a wolf attack. The deer could survive with medical attention. Would you support or oppose a decision by the rangers to help the animal?”
- The fourth dimension was about “preferences for euthanasia when wild animals are suffering and have little hope of survival.” Responses to the following item had a strong correlation with this dimension: “A wild goat has fallen from the mountainside and is severely injured. The goat hasn’t moved for 18 hours and is bleating in distress. A villager quickly ends the life of the goat with his machete when he sees it. Do you support or oppose the decision of the villager to end the goat’s life?”
Another dimension was also suggested by the analysis, but because it did not seem clearly defined by the questions which most correlated with it, this dimension was not named by the Researcher. The four named dimensions accounted for 34.5% of the variance in responses. For further information about the interpretation and correlations of the dimensions please see the full report.
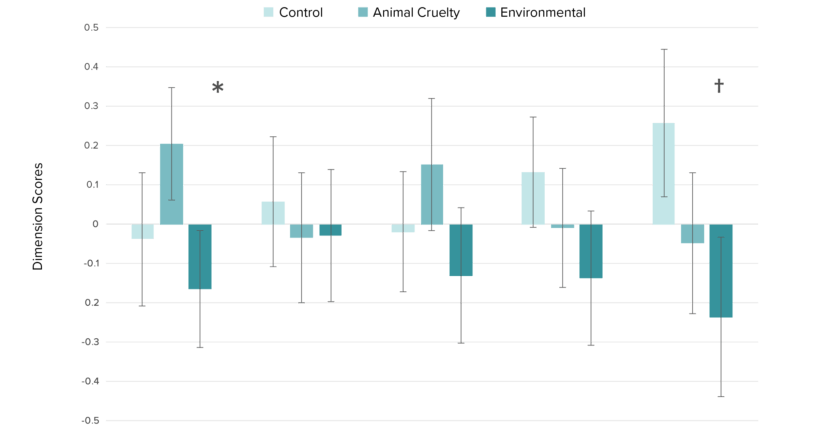
We used t-tests to examine whether participants in our experimental conditions (i.e., environmental message vs. animal cruelty message vs. control message) differed in their attitudes towards each of the WAS dimensions we identified (see Figure Two).6 The statistical significance level for each test was adjusted to account for the multiple comparisons by using the Bonferroni correction. The only statistically significant difference we observed between groups shown different meat reduction appeals was quite counterintuitive: participants in the animal cruelty group reported greater “preferences for more habitat” than participants in the environmental group, t(375.5)=3.52, p=0.0005.

| Mean “preferences for more habitat” score | Mean “preferences for reducing suffering of a population of wild animals” score | Mean “preferences for saving an individual wild animal” score | Mean “preferences for euthanasia when wild animals are suffering and have little hope of survival” score | Mean “undefined fifth dimension” score | |
|---|---|---|---|---|---|
| Control | -0.038 | 0.057 | -0.019 | 0.133 | 0.257 |
| Animal Cruelty | 0.205 | -0.034 | 0.152 | -0.01 | -0.047 |
| Environmental | -0.164 | -0.028 | -0.131 | -0.136 | -0.236 |
The error bars in Figure 2 represent 95% confidence intervals.
(∗) There was a statistically significant difference between the animal cruelty group and the environmental group on this dimension.
(†) There was a statistically significant difference between the control group and the environmental group on this dimension.
Given the still preliminary nature and unexpectedness of the significant difference between the animal cruelty group and the environmental group, we don’t currently think it is worth speculating about its potential causes and implications. We would only be interested in speculating if the result were supported by further experimental evidence.
Conclusions
The purpose of this study was to investigate how different meat reduction appeals influence attitudes towards policies and decisions that affect WAS. We hypothesized that the animal cruelty group would show greater support for the options that reduce WAS than the control group and that the control group would show greater support for options that reduce WAS than the environment group. In contrast to our hypothesis, we actually observed that the animal cruelty group had significantly greater “preferences for more habitat” than the environment group. Our interpretation was that this indicated that relative to the environmental flyer, the animal cruelty flyer strengthened preferences that would increase WAS, given that more habitat would increase the number of wild animals and that in turn would increase the amount of WAS.7 This result did not support our hypothesis, which could be informative, but because of the small amount of supporting evidence8 we would like to see this replicated in further experiments before we place moderate weight on it.
Although we struggled to draw firm conclusions from the experimental results, this study was helpful to us because it highlighted the complexity of measuring WAS related attitudes. The results of the EFA provide strong evidence that rather than thinking of attitudes towards WAS as a unidimensional construct, where people either support or oppose reducing WAS, it is more accurate to consider the multiple distinct dimensions underlying attitudes towards actions that reduce WAS. This research is the first to empirically attempt to identify what those distinct dimensions might be, and it suggests that there could be several underlying WAS relevant attitudes—ranging from large scale habitat quantity preferences to opinions about helping an injured wild animal. We would like to see the number of dimensions and interpretation of what those dimensions represent verified by further research before we feel confident that the dimensions identified in this study best describe these attitudes.
While this study improved our understanding of how attitudes affecting WAS can be described—and will be useful in informing further experimental research on the topic—we should have spent more time reviewing the study before its implementation. The study was done primarily by an intern who was operating on a restrictive timeline, and it would have benefitted from further review and critique from the research team than we were able to obtain at the time. In hindsight, we should probably have used a longer survey that had a greater number of questions relating to each dimension we predicted would be present. In our interpretation we could then have more confidently interpreted what each of the dimensions indicated by the EFA represented. A larger sample size would also have allowed us to be more confident in the results. That way, the results from some of the sample could be used to identify the dimensions and then the remainder of the sample could be used to test whether these dimensions seemed appropriate. For future experiments we will be obtaining more feedback, as detailed in our recent blog post about our new research review process.
We feel that further research is necessary in order to clearly define the different dimensions that can be used to describe attitudes towards policies and decisions affecting WAS, as well as to identify sets of questions that can be used in scales to measure those dimensions. Likewise, significant further research is required to determine how ideas promoted during farmed animal advocacy affect attitudes that impact WAS.
This study’s full technical report, along with further relevant materials can be found on the Animal Advocacy Data Repository.
“Nature” in this sentence refers to things that are not made or caused by humankind.
ACE previously also completed an initial exploratory study on this topic.
The participants who participated in the previous study were excluded from also participating in this study.
This Social Research Methods page has some further discussion of unidimensional and multidimensional constructs.
An absolute value greater than 0.3 is a commonly used significance level for factor loadings (e.g., Knafl and Grey, (2007)).
Each participant was assigned a score on each of these dimensions via a regression that accounted for their response and the dimension’s overall correlation with each of the items.
Note, here we do not commit to whether there is a preponderance of negative conscious experience over positive conscious experience in wild animals. Instead, we just state that the total amount of WAS would increase if there were more wild animals.
Two habitat destruction questions used in this experiment were also used in the previous WAS experiment. The results from the previous WAS experiment for both these questions was that the animal cruelty group reported more opposition towards habitat destruction than the environment group, although these differences were smaller than the differences found in the present experiment and were not significant. This limited agreement in the differences in the previous WAS experiment and the significant differences in preferences for more habitat detected in the present experiment could be due to the present experiment better measuring preferences for habitat quantity by using a greater amount and variety of questions.
Filed Under: Research Tagged With: messaging, wild animals
About Kieran Greig
Kieran’s background is in science and mathematics, his core interest is effective altruism, and he joined the team as a Research Associate in 2017.
“We hypothesized that the animal cruelty group would show greater support for the options that reduce WAS than the control group and that the control group would show greater support for options that reduce WAS than the environment group. In contrast to our hypothesis, we actually observed that the animal cruelty group had significantly greater “preferences for more habitat” than the environment group.”
One possibility is that the animal cruelty group did show greater support for the options that reduce WAS, where members of the group believe that destroying habitat increases WAS. On this view, the animal group did exactly as expected, and where they differ from ACE is in their beliefs about what increase and decrease WAS. This seems like a very plausible possibility to me.
Thanks for the comment Jason.
I partially agree with that reasoning, that is quite plausibly why the animal cruelty group would show greater support than the other groups for some options that likely increase WAS. However, I don’t think that reasoning is totally consistent with the results from this experiment. For instance:
(i) That reasoning would predict a significant difference between the control group and the animal cruelty group rather than a significant difference between the animal cruelty group and the environmental group.
(ii) That reasoning would probably also suggest there would be significant differences on the other named dimensions but a significant difference was only observed on the “preferences for more habitat dimension.”
Given the results are still quite preliminary, I feel it is worth seeing whether they are supported by further research before further speculating about their possible causes or implications.